Investigate the results
Assessing completion
Upon pipeline completion, verify that all steps have completed without error by checking the top-level log (called WGS_<datestamp>.out if using the optional wrapper script; otherwise see Snakemake’s documentation for the default location of stdout). The bottom few lines of the file should contain something similar to nnn of nnn steps (100%) done. Additional job logs (when run on a high-performance computing cluster) are stored in the logs/ sub-directory.
Outputs and results
All pipeline results are stored in the results/ directory.
The hard-filtered, joint-called VCF can be found in
results/HaplotypeCaller/filtered/HC_variants.hardfiltered.vcf.gzFor future joint-calling, the gVCFs are located at
results/HaplotypeCaller/called/<sample>_all_chroms.g.vcf.gzDeduplicated and post-BQSR bams are found at
results/bqsr/<sample>.bam
Samples that fail the following thresholds are automatically removed from the above joint-called VCF, and the output is placed in results/post_qc_exclusions/samples_excluded.HC_variants.hardfiltered.vcf.gz. The record of sample exclusions, along with reasons for exclusion, is found at results/post_qc_exclusions/exclude_list_with_annotation.tsv. Values listed are defaults, but can be changed in the config.yaml.
Average depth of coverage < 20x
Contamination > 3%
Het/Hom ratio > 2.5
QC
The following QC metrics are available (depending on run mode selected):
Pre- and post-trimming FastQC reports at
results/fastqc/andresults/post_trimming_fastqc/, respectivelyTrimming stats via fastp at
results/paired_trimmed_reads/Alignment stats via samtools at
results/alignment_stats/Recalibration stats from bqsr at
results/bqsr/Relatedness via Somalier at
results/qc/relatedness/Sample contamination via verifyBamID at
results/qc/contamination_check/(for full runs only; not included in joint-genotyping only run mode)Inferred sex via bcftools +guess-ploidy at
results/qc/sex_check/Picard metrics at
results/HaplotypeCaller/filtered/bcftools stats at
results/qc/bcftools_stats/MultiQC report at
results/multiqc/Benchmarking report of pipeline performance statistics (i.e. elapsed time, memory and CPU utilization for rules above specified
time_thresholdinconfig.yaml) atperformance_benchmarks/benchmarking_report.htmlRun summary report for the pipeline, excluded samples and discordances at
results/run_summary/run_summary.html
Examples
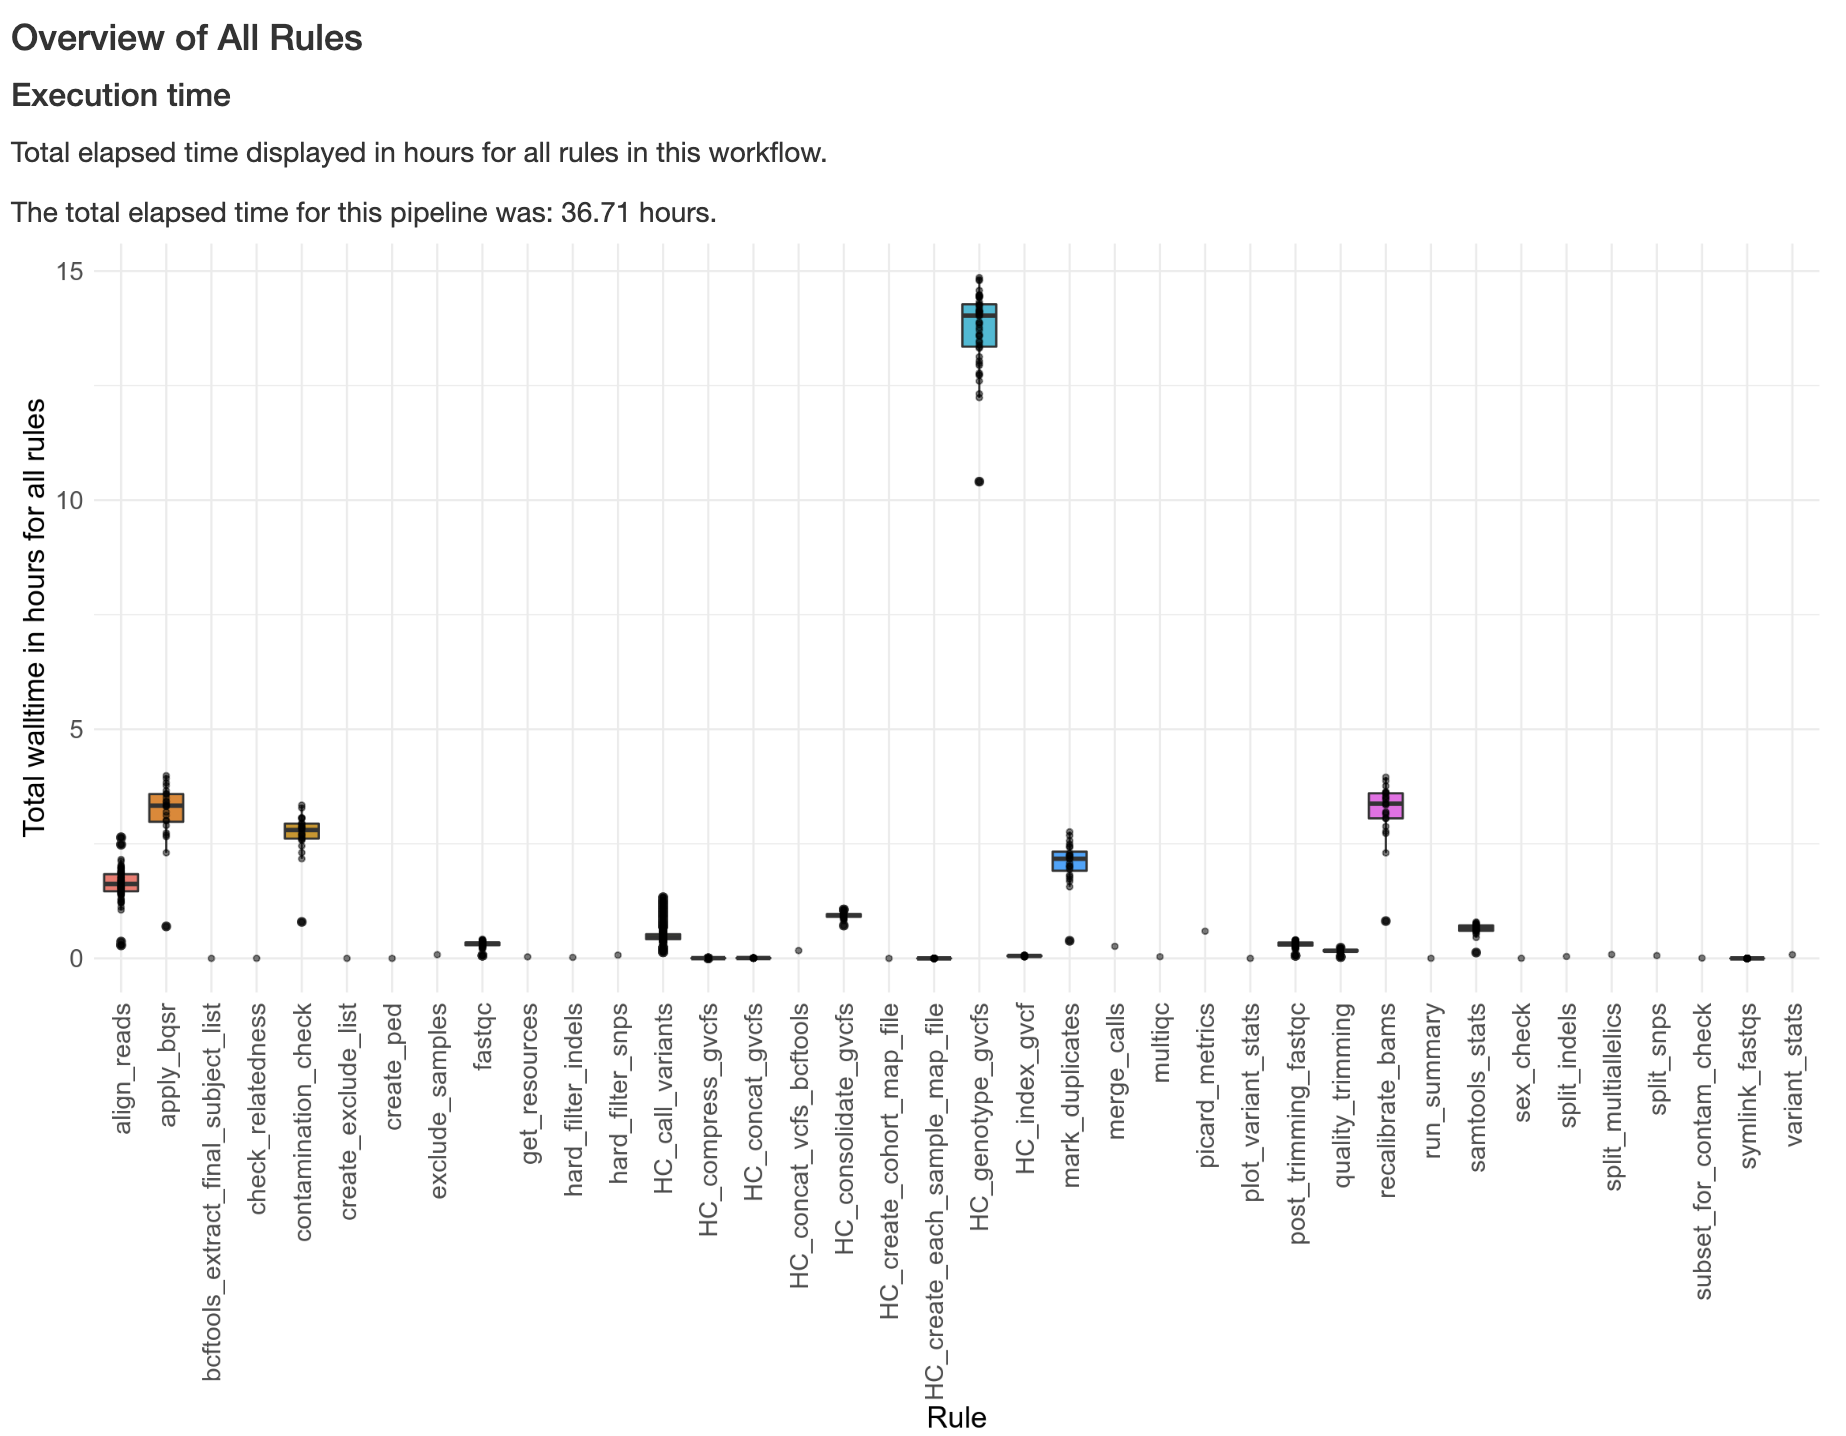
Below is an example of a plot from the benchmarking_report.html report generated, showing execution time across rules in a pipeline run:
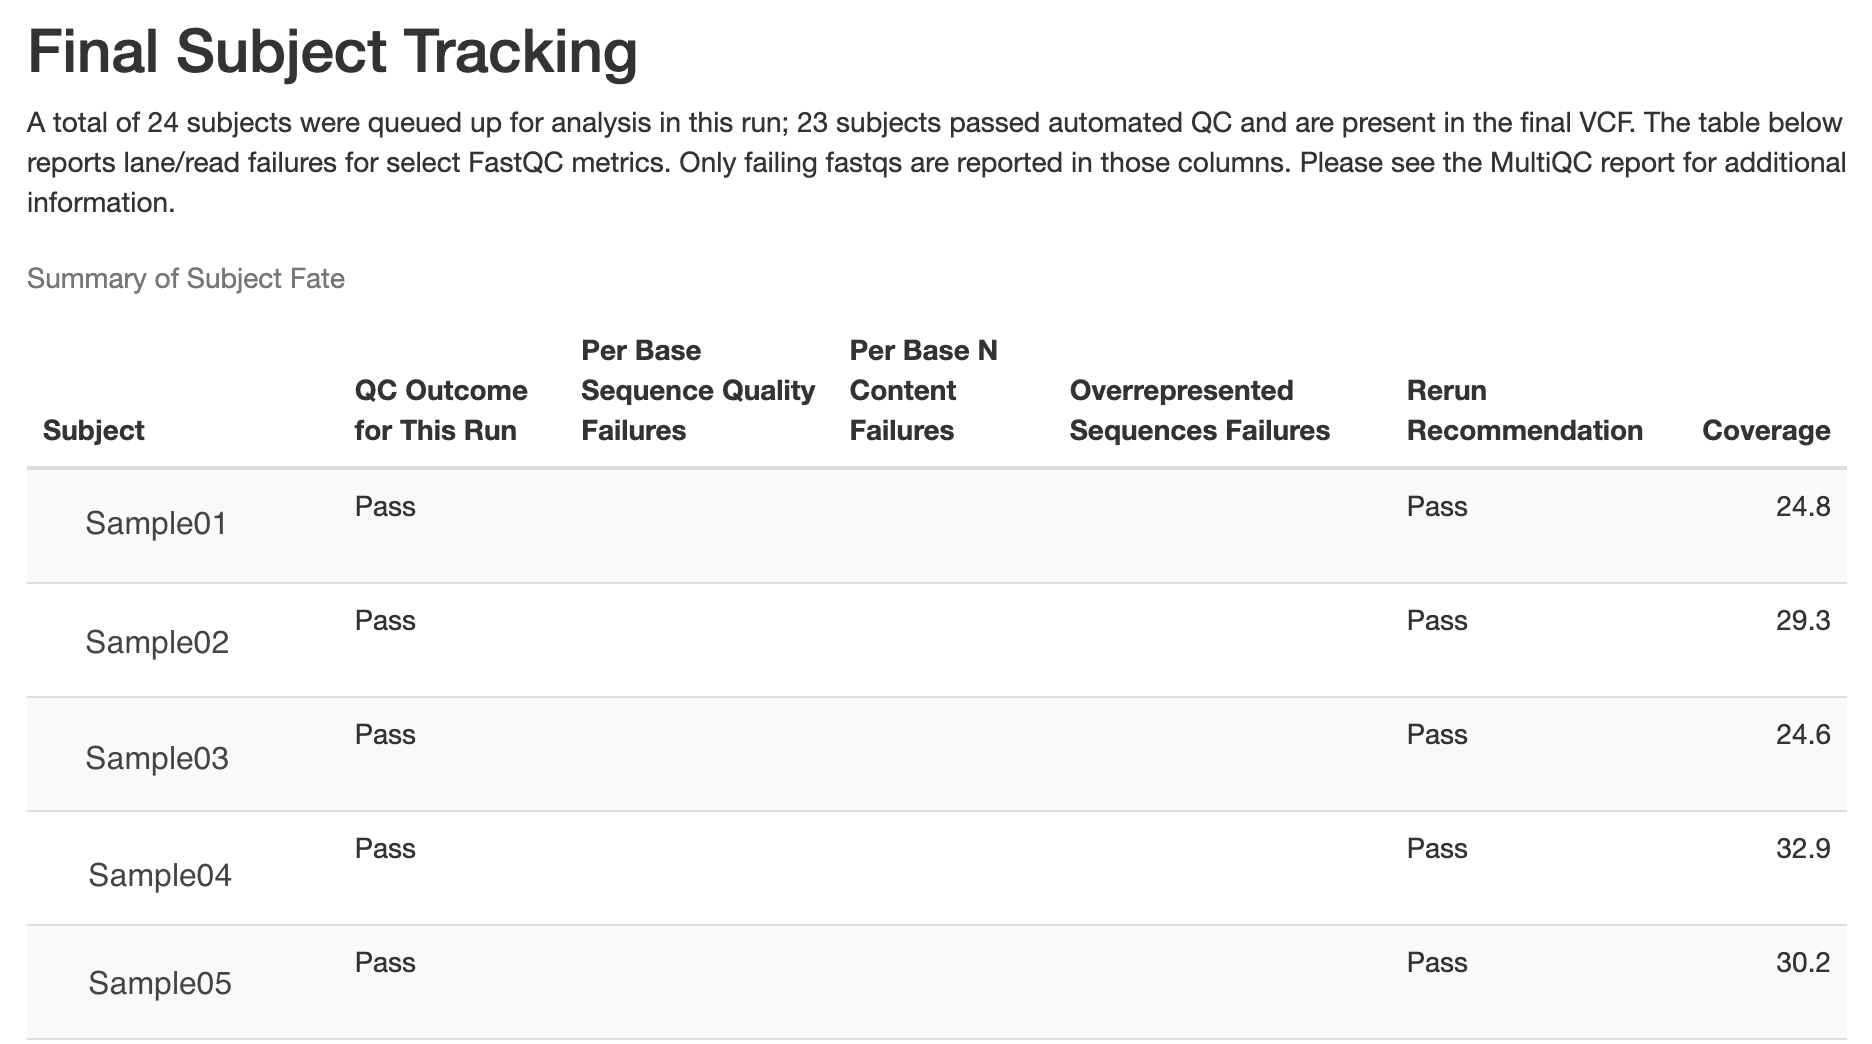
Below is an example of the final subject tracking table generated in the run_summary.html report, showing QC outcomes for subjects included in a pipeline run: